Investigation of Impacts of Mining and Transportation Activities on Ambient Air Quality of Dhanbad City
Sridevi Jena1*, Atahar Perwez1, Gurdeep Singh2and Ashok Kumar Dubey1
1Department of Environmental Science and Engineering, Indian School of Mines, Dhanbad, India
2Vinoba Bhave University, Hazaribag, Jharkhand India
DOI:http://dx.doi.org/10.12944/CWE.10.3.35
The present study was intended to emphasize the assessment of ambient air quality of Dhanbad city with respect to PM10, PM2.5, SO2and NOXconcentrations, in order to investigate the impact of mining and transportation activities. From the monitoring and analysis at four selected monitoring stations during winter and summer seasons, significant spatial variation in pollutant (PM10, PM2.5, SO2and NOX) concentrations is quite evident. The concentrations of PM10were observed highest in mining area (at Dhansar PS; 291 µg/m3), whereas the PM2.5the concentrations were observed higher along traffic routes (especially, at Bank More; 218 µg/m3). Higher concentratios of PM10in mining area indicates the substantial impact of dust emanated from mining and associated activities on air quality. Whereas, the higher PM2.5concentration along the transportation routes shows the influence of transportation activities on the airshed of the area. The significant seasonal variation in pollution levels is also apparent, as the concentrations of every pollutant were observed higher during the winter, than the summer season, at all sites. The mean concentration levels of PM10and PM2.5were observed 267 µg/m3, 173 µg/m3and 234 µg/m3, 108 µg/m3during winter and summer seasons, respectively. From the calculated values of air quality index, it is evident that Dhansar PS and Bank More are most polluted sites and PM10is the most alarming pollutant in the area under investigation.
Copy the following to cite this article:
Jena S, Perwez A, Singh G, Dubey A. K. Investigation of Impacts of Mining and Transportation Activities on Ambient Air Quality of Dhanbad City. Curr World Environ 2015;10(3) DOI:http://dx.doi.org/10.12944/CWE.10.3.35
Copy the following to cite this URL:
Jena S, Perwez A, Singh G, Dubey A. K. Investigation of Impacts of Mining and Transportation Activities on Ambient Air Quality of Dhanbad City. Curr World Environ 2015;10(3). Available from://www.a-i-l-s-a.com/?p=12950
Download article (pdf)
Citation Manager
Publish History
Select type of program for download
| EndnoteEndNote format (Mac & Win) | |
| Reference ManagerRis format (Win only) | |
| ProciteRis format (Win only) | |
| Medlars Format | |
| RefWorks FormatRefWorks format (Mac & Win) | |
| BibTex FormatBibTex format (Mac & Win) |
Article Publishing History
| Received: | 2015-09-21 |
|---|---|
| Accepted: | 2015-10-11 |
Introduction
Air pollution is a major concern before scientific communities and policy makers all over the world, especially in developing countries. With the rapid growth in population, urbanization, industrialization and economic growth, there is a steady surge in demand of mining and energy sectors. This puts a substantial pressure on the environmental regime, particularly on the ambient air. The mining and energy industries are the foremost sectors responsible for the severe deterioration in air quality besides their significant contribution to the economic development. At present, energy is chiefly produced by fossil fuels (coal, petroleum oil and natural gas).1Among these, coal is the most abundantly present and cheapest source of energy.2
Jharia coal-field (JCF) located in Dhanbad, is one of the most important and the most exploited coal-field of India because of available metallurgical grade coal reserves. Jharia coal-field is subjected to intensive mining activities and accounts for 30% of the total Indian coal production.3The mining and associated activities deteriorate the ambient air quality through the emissions of particulate matters (PM), sulfur dioxide (SO2) and nitrogen dioxide (NO2).4This coal field is also of great concern because of the mine fires, spread over an area of approximately 18 km2.4Besides mining and energy sector, another most important activity, deteriorating air quality is vehicular transportation. Vehicular (Paved/unpaved) transportation is known to contribute a considerable load of particulate matter (PM10and PM2.5),5,6,7,8,9,10,11oxides of nitrogen (NOX).12
Particulate matters are pollutants of major concern because of its diverse nature (size and composition) and complexity of sources. The particulate matters carry toxic pollutants such as heavy metals13and toxic organic compounds. Metals associated with respirable particles have been shown to increase lung and cardiopulmonary injuries in humans.14Particulate matters also reduce visibility and adversely affect surrounding flora and fauna.15,16
The huge impacts of mining and transportation activities on the ambient air quality obligates the assessment pollution levels in this area. Further, this area (Dhanbad) is declared as a critically polluted area and ranked 13thamong 88 industrial areas, with a score of 78.60 out of 100 by Central Pollution Control Board (CPCB) in consultation with the Ministry of Environment and Forests, Government of India.17The objective of the study was to investigate the scenario of air pollution in mining and urban areas of Dhanbad in order to assess the impact of the dominant anthropogenic activities (mining and transportation) on ambient air quality. For the assessment, the monitoring was done during winter and summer seasons at four selected monitoring stations with respect to PM10, PM2.5, SO2and NOX. Based on the observed concentration of pollutants, air quality index (AQI) values were also estimated for better understanding and interpretation of the pollution levels.
Study Area
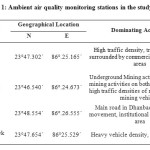
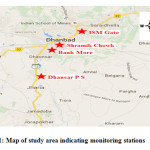
Dhanbad is the third largest city in Jharkhand State and is known as the coal capital of India. It lies between 23°37’3” N to 24°4’ N latitude and between 86°6’30” E to 86°50’ E longitude, having an mean elevation of 222 m. Dhanbad is situated in the subtropical climatic zone and and experiences a cool winter and hot summer season. The temperature varies approximately between 11â°C to 22â°C during winter and 25â°C to 45â°C during summer season. This region receives heavy rainfall (approximately 1300 mm) annually. Open-cast coal mines, coal washeries, coke oven plants, mine fires as well as transportation (mining and non-mining) activities are the major sources of air pollution in this city. For the purpose of systematic ambient air quality monitoring, four (4) representative monitoring stations were selected in the study as per the siting criteria provided by IS: 5182 Part XIV.18The details of monitoring stations are presented in Table 1 and Figure 1. Among the four stations, Dhansar P.S. represents a mining area and Bank More, Shramik Chowk and ISM Gate represent traffic routes. Bank More and Shramik Chowk are traffic junctions (dominated by the heavy load of vehicular traffic) and also commercial as well as residential areas. ISM Gate is a institutional as well as residential area (dominated by moderate loads of vehicular traffic).
Methodology
The study was conducted during Winter (January-February) and Summer seasons (April-May) in the year 2015, with respect to PM10, PM2.5, SO2and NOX. The samples were collected on 24 hourly basis at 4 different locations once a week. Ambient samples of PM10were collected by resipirable dust sampler (Envirotech APM 460 NL) (flow rate of 1.1 m3min–1) on Whatman glass fiber filters and PM2.5samples were collected by fine particulate sampler (Envirotech APM 550 MFC) (flow rate 16.7LPM) on PTEF filter papers. The samples of SO2and NOXwere collected by thermo-electrically cooled gaseous samplers (Envirotech APM 411 TE) through wet chemical method. SO2, present in the ambient air is absorbed (flow rate 0.4 LPM) in a of solution 0.04 M potassium tetrachloromercurate (K2HgCl4) to form non-volatile dichlorosulfitomercurate (HgCl2SO3) and analyzed by following the improved West and Gaeke method.19The NOXconcentration in ambient air, was determined by absorbing the NOXby a solution of 0.4% sodium hydroxide (NaOH) and 0.1% sodium arsenite (NaAsO2–) with a flow rate 0.5 LPM to form sodium nitrite (NaNO2) and analyzed by following the modified Jacob and Hochheiser method20.
 |
|
 |
|
Results and Discussion
The concentration levels of PM10, PM2.5,SO2and NOXat four selected monitoring locations during winter and summer seasons is presented in Table 2. The results reveal a significant variation in pollutant concentrations (PM10, PM2.5, SO2and NOX) in mining area and along traffic routes. The PM10concentrations were observed highest in the mining area (at Dhansar PS) during the study period (291 µg/m3during winter and 281 µg/m3during summer), followed by traffic routes (Bank More, Shramik Chowk and ISM Gate). The concentration levels of PM10were found exceeding the NAAQS by the factor of 2.9, 2.9, 2.7 and 2.2 (100 µg/m3)21at Dhansar PS, Bank More, Shramik Chowk and ISM Gate, respectively during winter season. While, during the summer season the PM10concentrations were observed 2.8, 2.5, 2.4 and 1.7 times higher than the NAAQS at the respective sites. The higher concentration of PM10at Dhansar PS is attributed to dust emanated from closely situated open cast coal mines and extensive movement of small and heavy duty vehicles (mining as well as non-mining). Whereas, vehicular emissions (especially resuspension of settled dust particles) are the prime source of elevated concentrations of PM10at Bank More and Shramik Chowk. Shramik Chowk and Bank More are the two busiest traffic junctions in Dhanbad city. The heavy movement of vehicles and restricted ventilation condition (due to closely surrounding buildings) makes the site seriously polluted.
 |
|
Unlike PM10, the concentrations of PM2.5were observed higher along the traffic routes (highest at Bank More; 218 µg/m3during winter and 119 µg/m3during summer), followed by mining area (Dhansar PS). The PM2.5concentrations were found to be exceeding the NAAQS (60 µg/m3)21by the factor of 3.7, 3.4, 2.3 and 2.2 at Bank More, Shramik Chowk, ISM Gate and Dhansar PS, respectively during winter season. While, during the summer season, the PM2.5concentration were observed to be 2.0, 1.8, 1.8 and 1.6 times higher than NAAQS at Bank More, Shramik Chowk, ISM Gate and Dhansar PS, respectively. The exceedance of PM2.5at the monitoring locations is attributed to the substantial influence of vehicular emissions at the sites. Because, fine particles are primarily generated from fossil fuel combustion processes and vehicular emission is its leading source in the urban areas. The elevated concentrations of PM10and PM2.5, indicates a significant impact of mining and transportation activities on the ambient air quality of the area under consideration.
Apart from the particulate pollutants, a substantial variation in spatial distribution of gaseous pollutants was also observed. The concentration of SO2was observed highest at Dhansar (73 µg/m3) followed by Bankmore (27 µg/m3), Shermic chock (21 µg/m3) and ISM Gate (16 µg/m3) and at Dhansaar SO2concentration was 1.1 times higher than the NAAQS (80 µg/m3).21NOXconcentration was observed at highest at Bankmore (92 µg/m3) followed by Shermik Chowk (61 µg/m3), Dhansar (53 µg/m3) and ISM Gate (40 µg/m3). The main reason of higher concentrations of SO2and NOXat Dhansar PS are mine fire and vehicular emission.
The seasonal variation in concentration of pollutants under consideration (PM10, PM2.5,SO2and NOX) is also quite evident. The concentrations of each pollutant was observed higher during the winter, than the summer season, at all sites. Higher concentration during winter is attributed to the prevalence of anti-cyclonic conditions, characterized by calm or light winds and limited mixing depth due to a stable or inversion of atmospheric lapse rate22. The respective mean concentrations of PM10and PM2.5in the study area were observed 267 µg/m3, 173 µg/m3during winter and 234 µg/m3, 108 µg/m3during summer. Whereas, the mean concentration levels of SO2and NOXwere observed 40 µg/m3, 66 µg/m3and 28 µg/m3, 56 µg/m3during winter and summer seasons, respectively. Similar trends of seasonal variation in particulate matter concentrations were also observed in different areas of India such as Jharia Coalfield,23around Dhanbad city,24around Dhanbad city,4Sambalpur region22and Raniganj-Asansol area.25
 |
|
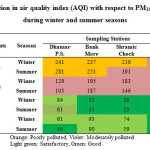
For better understanding and interpretation of the pollution levels as well as to identify the levels of health concern, air quality index (AQI) was calculated and selected monitoring stations were categorized accordingly on the seasonal basis. The indexing was done by following the Indian National Air Quality Index (INAQI).26The calculated AQI for each monitoring station is depicted in Table 3. The AQI values with respect to PM10被发现在Dhansar PS和一个糟糕的污染吗s Bank More and were found moderately polluted at ISM Gate, during both seasons. Whereas, Shramik Chowk was observed poorly polluted during winter and moderately polluted during the summer season. The air quality status with respect to PM2.5was observed moderately polluted at all monitoring stations during both seasons. While, with respect to SO2and NOX, the air quality status was found satisfactory and good. The observed AQI values and the respective categories illustrate that Dhansar PS and Bank More are the most polluted sites and PM10is the most alarming pollutant.
Conclusions
The aim of this study was to investigate the ambient air quality of Dhanbad city with respect to PM10, PM2.5, SO2and NOXmonitored at four representative locations. The spatial and seasonal variations in pollutant concentrations were quite significant, which may be caused by diversity among emission sources and prevailing meteorological conditions. From the observation, PM10and PM2.5were found as major pollutants to be concerned, because, the concentration levels of PM10as well as PM2.5at all monitoring stations exceeded the NAAQS (2009) annual permissible limit. The concentration of SO2was observed highest at Dhansar PS (73 µg/m3), whereas NOXconcentration was observed highest at Bank More (92 µg/m3), which may be attributed to mine fire and vehicular emissions, respectively. Air quality index (AQI) was also calculated by following the National Air Quality Index (NAQI CPCB, 2014). The air quality index revealed that, the airshed of the area is moderately to poorly polluted with respect to PM10and PM2.5, while good to satisfactory with respect to SO2and NOX. From the careful observation of the AQI values and its respective categories, Dhansar PS and Bank More are found most polluted sites and PM10is identified as the most alarming pollutant in the area under investigation. Based on the observations, the study portrays the need of detailed time series study of pollutant concentrations, source apportionment study of particulate pollutants (to understand the source profile) and study on dispersion characteristics of the airshed in the future.
Acknowledgement
The authors are thankful to the Indian School of Mines, Dhanbad for the valuable support during the study. Three authors (Sridevi Jena, Atahar Perwez and Ashok Kumar Dubey) are also thankful to the Ministry of Human Resource Development for providing ISM JRF fellowship.
References
- Veziroglu, T. N., Sahin, S., 21st Century’s energy: Hydrogen energy system. Energy Conversion and Management, 49: 1820-1831 (2008)
- Franco, , & Diaz, A.R., The future challenges for "clean coal technologies": Joining efficiency increase and pollutant emission control. Energy, 34: 348-354 (2009)
- Ghose, M. K., & Majee S. R., Characteristics of air-borne dust emitted by opencast coal mining in Jharia Coalfield Journal of Chemical Technology, 8: 417-424 (2001b)
- Pandey, B., Agrawal, M., & Singh, S., Assessment of air pollution around coal mining area: Emphasizing on spatial distributions, seasonal variations and heavy metals, using cluster and principal component analysis. Atmospheric Pollution Research, 5: 79â€86 (2014)
- Chaloulakou, A., Kassomenos, P., Spyrellis, N., Demokritou, P., & Koutrakis, P., Measurements of PM10and PM5particle concentrations in Athens, Greece. Atmos. Environ., 37: 649-660 (2003)
- Chan, C. K., & Yao, X., Air pollution in mega cities in China. Atmos. Environ., 42:1-42 (2008)
- Deshmukh, D. K., Deb, M. K., & Verma, S. K., Distribution patterns of course, fine and ultrafine atmospheric aerosol particulate matters in major cities of Chhattisgarh. Indian. J Environ Prot., 30: 184-197 (2010a)
- Deshmukh, D.K., Deb, M.K., Tsai, Y.I., & Mkoma, S.L., Atmospheric ionic species in PM5and PM1aerosols in the ambient air of eastern central India. J. Atmos. Chem., 66: 81-100 (2010b)
- Katiyar, S. C., Khathing, D. T., & Dwivedi, K. K., Assessment of breathing level ambient air quality of Shilong: Part 1: total suspended particulate loadings. Indian J. Environ. Prot., 22:115-122 (2002)
- Vega, E., Eidels, S., Ruiz, H., Lopez Veneroni, D., Sosa, G., Gonzalez, E., Gasca, J., Mora, V., Reyes, E., Sanchez-Reyna, G., Villasenor, R., Chow, J.C., Watson, J.G. & Edgerton, S.A., Particulate air pollution in Mexico City: a detailed view. Aerosol Air Qual. Res., 10: 193-211 (2010)
- Wang, W., Chai, F., Zhang, K., Wang, S. L., Chen, Y. Z., Wang, X. Z. & Yang, Y.Q., Study on ambient air quality in Beijing for the summer 2008 Olympic Games. Air Qual Atmos Health, 1: 31-36 (2008)
- Melkonyan, A., & Kuttler, W., Long-term analysis of NO, NO2and O3concentrations in North Rhein-Westphalia, Germany. Atmos. Environ., 60: 316-326 (2012)
- Gunawardana, C., Goonetilleke, A., Egodawatta, P., Dawes, L., & Kokot, S., Role of solids in heavy metal pollution of receiving waters. J. Environ. Eng., (2011) do:10.1061/(ASCE)EE.1943-7870.0000487.
- Shaheen, N., Shah, M. H., Khalique, A., Jaffar, Metal levels in airborne particulate matter in urban Islamabad, Pakistan. Bulletin of Environmental Contamination and Toxicology, 75 (4): 739-746 (2005)
- 惠勒,A·J。威廉姆斯,我,博蒙特,r·A。& Manitol, R. S., Characterization of particulate matter sampled during a study of children’s personal exposure to airbone particulate matter in a UK urban Environment. Environmental Monitoring and Assessment, 65: 69-77 (2000)
- NIOSH-National Institute for Occupational Safety and Health, Significant Dust Dispersion Models for Mining Operations IC 9478. USA (2005)
- Kamyotra, s不如ve Environmental Assessment of Industrial Clusters, Central Pollution Control Board. Ministry of Environment and Forests, Ecological Impact Assessment Series: EIAS/5/2009–2010, TERI Press, New Delhi, p.3 (2009) http://www.cpcb.nic.in/upload/NewItems/NewItem_152_Final-Book_2.pdf.
- IS 5182 (Part 14): Methods for Measurement of Air Pollution, Part 14: Guidelines for Planning the Sampling of Atmosphere (Second Revision) (2000)
- IS 5182 Part 2, Method of Measurement of Air Pollution: Sulphur dioxide, (2001)
- IS 5182 Part 6, Methods for Measurement of Air Pollution: Oxides of nitrogen, (2006)
- CPCB(中央污染控制委员会)的国家bient Air Quality Standards (NAAQS). Gazette Notification, New Delhi., (2009)
- Chaulya, S. K., Assessment and management of air quality for an opencast coal mining area. Journal of Environmental Management, 701-14 (2004)
- Ghose, M. K., Majee, S. R., Assessment of the impact on the air environment due to opencast coal mining - an Indian case study. Atmospheric Environment, 34: 2791-2796 (2000b)
- Jain, M. K., & Saxena N. C., Air quality assessment along Dhanbad–Jharia road. Environmental Monitoring and Assessment, 79: 239-250 (2002)
- Reddy, G. S., & Ruj, B., Ambient air quality status in Raniganj–Asansol area, India. Environmental Monitoring and Assess men. 89: 153-163 (2003)
- National Air Quality Index. Control of urban pollution series. CUPS/ 82/ 2014-15. CPCB, New Delhi, (2015)


